Hearing Loss Types Audiogram: Understanding Hearing Test Results
Author: Dr Sagar Rajkuwar, ENT Specialist, Nashik, Maharashtra, India
🌐 www.entspecialistinnashik.com
An audiogram is a visual representation of your hearing sensitivity, with volume (loudness) plotted against sound pitch (frequency). By evaluating how sound goes through both the inner ear (bone conduction) and the outer and middle ear (air conduction), it distinguishes between the three main forms of hearing loss: sensorineural, conductive, and mixed.

Interpreting the Audiogram
- Horizontal axis (Frequency in Hz): Measures pitch, which ranges from low bass sounds (e.g., 250 Hz) to high treble sounds (e.g., 8000 Hz).
- Volume in dB on the vertical axis: It measures how loud a sound must be for you to hear it. The softer noises are at the top, and the louder ones are at the bottom.
- Headphone or earbud testing for air conduction symbols. denoted by O (Right Ear) and X (Left Ear).
- Symbols for Bone Conduction: Checked via a vibratory headband to avoid the middle and outer ears. Marked with > (Left) and < (Right).
The 3 primary categories of hearing impairment
1. Sensorineural Hearing Loss (SNHL)
What it is: The most frequent type, which is brought on by harm to the auditory nerve or inner ear (cochlea). Normally, it is lasting.
On the audiogram, air and bone conduction thresholds overlap, demonstrating low hearing in both. The results are continuous.
Causes include age (presbycusis), extended exposure to excessive noise, or genetics.
2. Hearing Loss Due to Conduction
What it is: Occurs when sound waves are prevented from entering the inner ear, most often as a result of an issue in the outer or middle ear.
Audiogram: The hearing is regular or near-normal according to bone conduction. Air conduction, though, exhibits poor hearing. This is referred to as an Air-Bone Gap, and it indicates a substantial difference between the two outcomes.
Common Cause: earwax buildup, middle ear fluid (from allergies or colds), or an ear infection.
3. Mixed Hearing Loss
What it is: A combination of conductive and sensorineural hearing loss. It implies that the outer/middle ear pathways and the inner ear are both damaged.
On the Audiogram: Air conduction levels are more affected than bone conduction thresholds, which are both abnormal. There is still an air-bone gap as a result.
Common Cause: A middle ear infection (conductive) and permanent age-related hearing loss (SNHL) are both present in the same person.
Hearing Impairment Categories
The severity of the loss, categorized on a dB scale, will be determined by your outcomes at a certain pitch:
- Normal: 20 to -10 dB
- Mild: 26 to 40 dB
- 41 to 55 dB is moderate.
- 56 to 70 dB is considered moderately severe.
- Severe: from 71 to 90 dB
- Deep: 91+ dB
For more information on understanding your test results and the numerous chart configurations, consult the American Speech-Language-Hearing Association’s (ASHA) complete guide.
Table of Contents
- What is an audiogram?
- Understanding Audiogram Symbols
- Types of hearing loss
- Human hearing range
- Where can I get an audiogram test close by?
- FAQs About Audiograms
What is an audiogram?
Audiograms are used by hearing care specialists to determine the degree and kind of your hearing loss. Discover the many forms of audiograms, symbols, and tests.
A hearing care expert graphs your results during a hearing test to illustrate the quietest sounds you can hear at various frequencies. An audiogram is what this is called. A complete map of your hearing function in both ears is called an audiogram. The softest sound you can hear is indicated by your audiogram. Sounds that are 20 dB or less at every frequency indicate healthy hearing.
Your hearing range shifts if you have hearing loss. How we perceive sound is influenced by two variables:
Frequencies – Like the notes of a piano, frequencies exist. The bass noises are at lower frequencies, and the soprano sounds are at greater frequencies.
Decibels (dB) – Decibels are a unit of loudness measurement. 0–20 dB is quite gentle. Very loud is 110dB, and it might be unpleasant to hear.
The high frequencies of the human hearing range will be affected first by hearing loss for the majority of individuals. The majority of those who have hearing loss find it difficult to hear certain noises, music, and speech.
Understanding Audiogram Symbols
One of the most significant challenges associated with hearing loss is that it impairs your capacity to comprehend speech. The majority of speech sounds are located within the so-called “speech banana” on the audiogram (see image), but some are found elsewhere.
Audiogram symbols consist of:
- The right ear’s hearing level is indicated by a red line.
- a blue line representing the level of hearing in an individual’s left ear
- Higher audiogram levels Lines on the audiogram are audible.
- The X illustrates that the left ear can hear.
- The O indicates hearing in the right ear.
Types of hearing loss
In addition, an audiogram may reveal the nature of your hearing loss. There are three types of hearing loss.
Sensorineural hearing loss occurs when the cochlea, which houses the auditory sensory organ, is the source of your hearing loss. Aging is the usual cause of this hearing loss. Genetic disorders or injuries caused by explosions or prolonged exposure to loud noises are other contributing causes. Hearing aids are beneficial for those who have sensorineural hearing loss.
Conductive hearing loss indicates that the sound is not reaching your inner ear. A middle ear problem, such as something obstructing the middle ear, is frequently to blame for this.
A mix of conductive and sensorineural hearing loss is referred to as mixed hearing loss.
Here is a speech banana and an audiogram with common sounds. The left ear exhibits a sensorineural hearing loss. The sounds in the white region are usually inaudible to someone with this audiogram.

Human hearing range
Our environment is home to a wide range of noises, from soft ones like rustling leaves and birdsong to louder ones like shouting, music, and industrial noise. The range of sound frequencies that humans with healthy hearing can detect is known as the audible range.
Pitch and loudness
A sound’s loudness and pitch (high or low) both affect how well a human can hear it. The pitch is measured in hertz (Hz), and the loudness is measured in decibels (dB).
A person with typical hearing has a hearing range that starts at about 20 Hz. The lowest pedal on a pipe organ is approximately the same as this.
In terms of noise level, prolonged exposure to sounds louder than 85dB might be hazardous to your hearing.
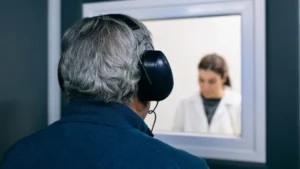
Where can I get an audiogram test close by?
A hearing care specialist may conduct a hearing test and record the findings on an audiogram. Here, you may find a hearing care expert nearby.
FAQs About Audiograms
Are audiogram tests painful?
No. A graph that displays the findings of your hearing test is known as an audiogram. A hearing test is a gentle procedure that evaluates your ability to hear sounds and attempts to determine the quietest sound level you can identify across a spectrum of frequencies. To put it another way, hearing tests illustrate your hearing loss in each ear and map how you perceive the most significant noises in your everyday existence.
Can an audiogram show hearing loss?
Indeed. A graph of the variety of sounds you can hear is known as an audiogram. If you have hearing loss, the graph will indicate that sounds must be louder for you to hear them than for someone without hearing loss. Your hearing care expert will explain the findings and guide you in comprehending the implications of your hearing loss and the range of accessible hearing solutions.
How is an audiogram test done?
Using headphones, the hearing test is typically done in a soundproof room or booth, with one ear being evaluated at a time at varying quantities and frequencies. When you can hear the sound, you typically press a button to react. You will get the findings that are displayed to you in an audiogram later. It doesn’t hurt, and the test isn’t too long.
How do you diagnose hearing loss from an audiogram?
A hearing care professional employs one of a number of tools to identify hearing loss, including the audiogram. By determining which noises you can and cannot hear, they are able to assess your hearing and, if necessary, suggest suitable hearing solutions.
How long does an audiogram take?
An audiogram is a representation of what you can and cannot hear after taking a hearing exam. Though time may differ depending on your needs, hearing exams often last under 30 minutes.
Is an audiogram the same as a hearing test?
No. Your hearing test findings are displayed in an audiogram.
What are audiograms typically used for?
To identify whether you have hearing loss and what kind of treatment is ideal for you, hearing professionals utilize the audiogram.
What are normal audiogram results?
People who do not suffer from hearing loss should be able to hear sounds at -10 to 20 dB.
What is a speech banana?
Where common speech sounds are found on an audiogram is shown by the speech banana. This area is banana-shaped, coincidentally. This audiogram illustrates someone with left ear mixed hearing loss and highlights the speech banana.
Where can I find an audiogram test near me?
A hearing professional may conduct a hearing test and record the findings on an audiogram. Here, you may find a hearing care expert nearby.
Summary
A graphic representation of hearing function that aids in the identification of sensorineural, conductive, and mixed hearing loss is called an audiogram. Audiologists can assess the type and degree of hearing loss and suggest suitable treatment choices like hearing aids, medical therapy, or additional assessment by assessing hearing thresholds at various frequencies and sound levels.
Medical Disclaimer
Medical Disclaimer: This article is for educational and informational purposes only and should not replace professional medical advice, diagnosis, or treatment. Always consult a qualified ENT specialist or audiologist regarding hearing problems, hearing loss, or interpretation of audiogram results.
References
- American Speech-Language-Hearing Association (ASHA) – Audiogram Interpretation and Hearing Loss Information.
- National Institute on Deafness and Other Communication Disorders (NIDCD)
- World Health Organization (WHO) Hearing Loss Factsheets
- Centers for Disease Control and Prevention (CDC) Hearing Loss Resources
- American Academy of Audiology – Hearing Assessment Guidelines.